
Sample Online/Blended Moodle Course
Section outline
-
Week 14: Class Project
-
Students mustMark as done
Class Project Information

There is no specific submission deadline in this week. However, I encourage you to use part of this week and next week to complete this class project. The class project carries 10% of your class grade.
The project is to use population data and temperature data of cities to test a hypothesis: greater the human population in cities, higher is the near-surface air temperature and rate of change of temperature.
In order to accomplish this project, you will obtain and plot temperature data and compare against the population data of nearby cities.
Task for this week is to work on temperature data. I will update the assignment later for population part as you continue to explore the temperature data.
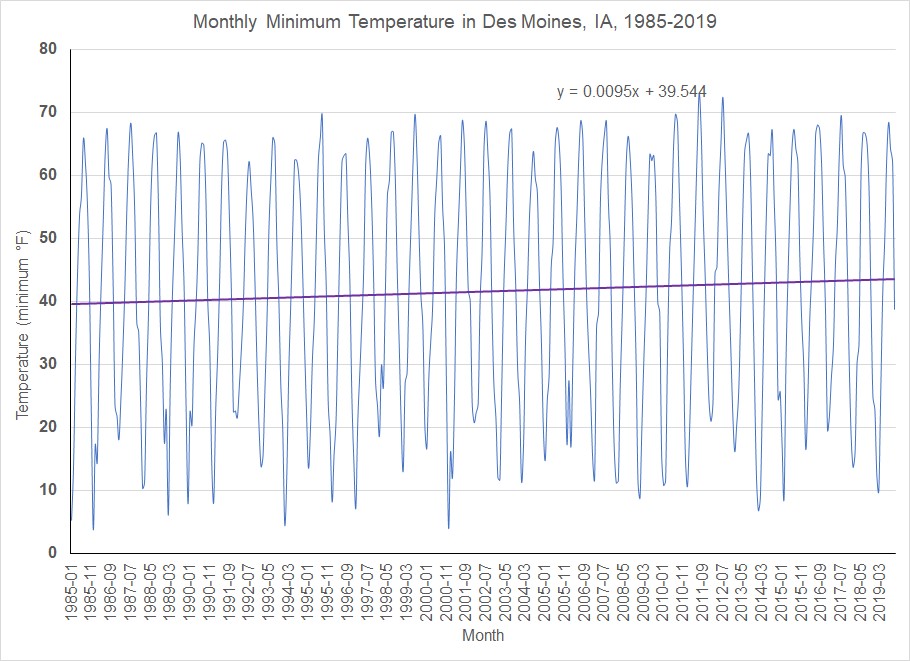
For the temperature data, you will find a city which have the temperature records of at least 30 years. Follow the video instruction for downloading the temperature and plotting it. Later, you will discuss in group about your charts and come up with a conclusion to support or reject the initial hypothesis.
-
Students mustMark as done
Week 14 Resources

How to order data from NOAA
How to plot time-series chart with a trend line
Population Data_Tutorial 1
Population Data_Tutorial 2
-
-
-
Students mustMark as done
Class Project: Assignments and Activities

Go to the National Climatic Data Center’s Local Climatological Data Map website below to find a weather station around the city of your choice. You will need to find a city which have the temperature records of at least 30-years.
https://gis.ncdc.noaa.gov/maps/ncei/
Go to the following website to find out change in population in US cities between 2010 and 2019: http://worldpopulationreview.com/us-cities/
And, finally to the website of us census to obtain the population data of cities for different years:
https://www.census.gov/data/tables/time-series/demo/popest/2010s-total-cities-and-towns.html
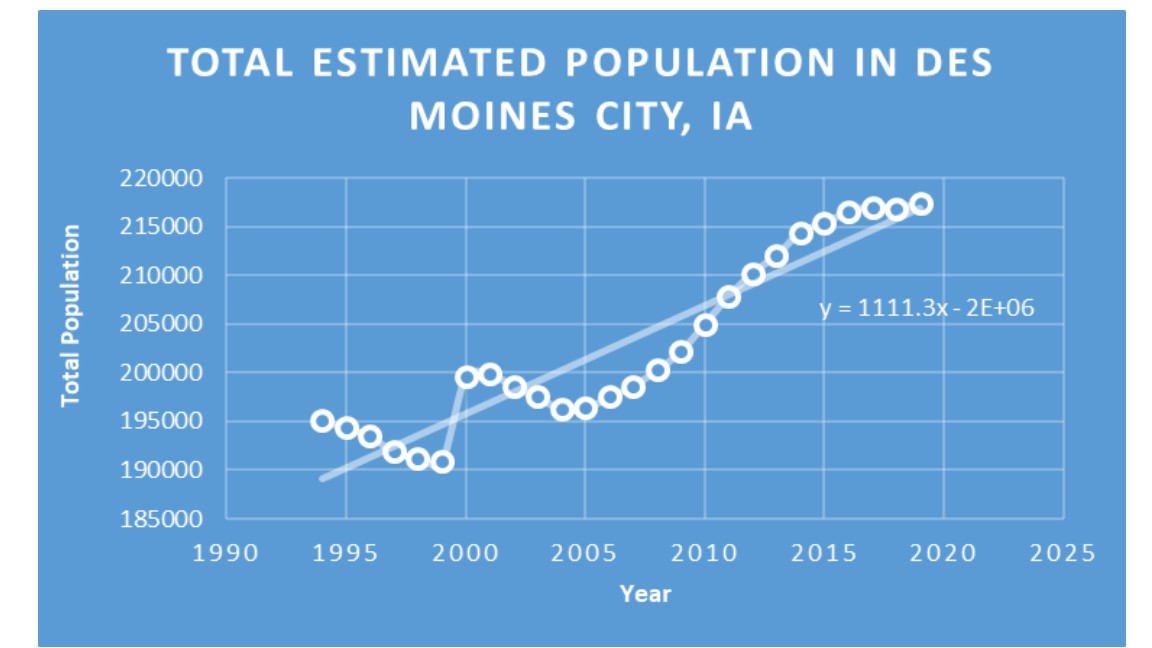
- Follow the video instruction to download data, transfer data in excel sheet, and plot on a time-series chart. In the video, I provided the example of Des Moines, Iowa. You find a different city that you are interested to explore the population and temperature. Each student needs to download and plot (time-series as instructed in tutorial videos) population from a city and temperature from a station in that same city. Save those graphs as image file (say JPEG) and post in the forum to discuss with your group members.
- Interpret the plot and conclude whether the chart you make presents evidence of atmospheric warming? Of cooling?
- Visually compare those two plots to discuss whether the initial hypothesis is valid or not.
- Students discuss in group why slope of the trend lines are different at different stations and times. Also, why some cities support our initial hypothesis and some don't. The discussion here should incorporate the facts the reading article has discussed.
- Individual student will further refine their graphs and discussion points and reach to individual conclusion to support or reject the hypothesis. You need to submit your individual project report in the assignment folder. Your initial post in group discussion, your input in group discussion and individual submission all will be considered in grading this project assignment.
Below are the example graphs from the example city of Des Moines, IA.
-
Students mustMark as done
Due: Thursday, December 5

-
Students mustMark as done
Post your graph here. You can save your chart as an image and insert here. Then put your interpretation of the chart in this forum. I will follow project grading rubric in grading this discussion.
-
Students mustMark as done
Due Sunday: December 8

-
Students mustMark as done
Submit your refined project outcomes:
1. Plots
2. Discussion on the plots
3. Conclusion
I will follow project grading rubric to grade this assignment.
-